

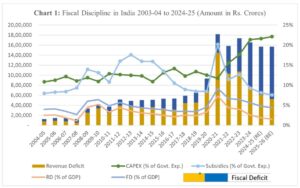
Indian economy under NDA and UPA: Fiscal and revenue deficits remain two of the most crucial indicators of an economy’s financial stability. In the Union Budget estimates for 2025–26, India’s fiscal deficit is projected at 4.4% of GDP, while the revenue deficit is pegged at 1.5%. Over the last two decades, India’s fiscal story has unfolded under two contrasting political regimes: the UPA government (2004–2014) and the NDA government (2014–2024) which has now secured a third consecutive term.
During the UPA’s tenure, the fiscal deficit quadrupled from Rs 1.25 lakh crore in 2003–04 to Rs 5.03 lakh crore in 2013–14. The NDA inherited this burden and saw the deficit grow to Rs 16.55 lakh crore by 2023–24. However, it has since shown consolidation, reducing it to Rs 15.7 lakh crore in the 2024–25 revised estimates and maintaining a similar level for BE 2025–26.
READ | India must strike a balance between financial inclusion, regulation
The story of the revenue deficit is similar. Under the UPA, it jumped more than 4.5 times — from Rs 0.78 lakh crore to Rs 3.57 lakh crore. In contrast, the NDA recorded a more restrained rise from Rs 3.65 lakh crore in 2014–15 to Rs 7.65 lakh crore in 2023–24, with expectations of further reductions to Rs 6.10 lakh crore in 2024–25 and Rs 5.24 lakh crore in 2025–26. This reflects a shift toward greater fiscal discipline.
At first glance, both regimes appear to have presided over rising deficits. This raises a pertinent question: despite growing deficits under the NDA, has it demonstrated better fiscal management and economic stewardship than its predecessor? To answer this, we must go beyond absolute numbers and explore the quality of expenditure, structural drivers of deficits, fiscal consolidation efforts, and performance in real terms.
Indian economy: FRBM targets and crisis management
“You can ignore the fiscal deficit, but the fiscal deficit won’t ignore you.”
The Fiscal Responsibility and Budget Management (FRBM) Act, 2003 set out to cap the fiscal deficit at 3% of GDP and eliminate the revenue deficit. While both regimes missed these targets, the reasons differ markedly.
The UPA began with a relatively stable fiscal position and brought the fiscal deficit down to 2.7% of GDP in 2007–08. However, the global financial crisis (GFC) in 2008 prompted a stimulus-led spending spree. The deficit surged to 6.4% in 2009–10 and remained elevated, ending at 4.4% of GDP in 2013–14 due to high subsidies and weak consolidation efforts.
The NDA began with fiscal consolidation in mind — reducing the deficit from 4.1% in 2014–15 to 3.4% in 2018–19. But the COVID-19 pandemic triggered emergency spending, pushing the deficit to an unprecedented 9.2% in 2020–21. Even so, the government managed to rein it in to 5.6% by 2023–24, with targets of 4.4% by 2025–26. Given the scale of the pandemic-induced disruption, this demonstrates comparatively stronger crisis management.
RBI dividends and banking sector repair: A notable feature of the NDA era has been the sharp increase in dividend payouts by the Reserve Bank of India. While the UPA received Rs 1.97 lakh crore over its decade in power, the NDA garnered Rs 8.21 lakh crore — a fourfold jump. These dividends helped bridge fiscal gaps but also reflect structural shifts.
The NDA, however, had to forgo the regular dividend income from public sector banks (PSBs) that the UPA had enjoyed, due to mounting non-performing assets (NPAs) and capital erosion. To restore credit growth and meet capital adequacy norms, the government injected Rs 34,997 crore into PSBs between 2016–17 and 2020–21. This strategic recapitalisation was critical to reviving the banking sector.
Finance commission awards and fiscal space: The role of the Finance Commissions is central to India’s fiscal federalism. Under the UPA, the 12th and 13th Finance Commissions recommended a state share of 30.5% and 32% in central taxes. The NDA went further—raising this to 42% (14th FC) and 41% (15th FC). While this devolution empowered states, it also reduced the Centre’s fiscal headroom, forcing it to re-prioritise spending and tighten controls.
Subsidies and the quality of expenditure: Subsidy trends offer insight into the nature of spending. During the UPA era, subsidies skyrocketed over sixfold — from Rs 39,661 crore to Rs 2.49 lakh crore. In contrast, the NDA registered a modest 55% rise — from Rs 2.65 lakh crore to Rs 4.12 lakh crore, despite pandemic-induced food subsidies.
A key difference lies in the composition. The NDA deregulated petroleum prices, reducing the burden of fuel subsidies, while using fiscal space to expand food security during COVID-19. This reflects a shift from consumption-heavy to more targeted, welfare-oriented expenditure.
Capital expenditure: Perhaps the most defining aspect of the NDA’s fiscal approach has been its sharp focus on capital expenditure. Capex rose from Rs 1.81 lakh crore in 2014–15 to Rs 9.5 lakh crore in 2023–24 — a fivefold jump. The BE for 2025–26 pushes this further to Rs 11 lakh crore.
In contrast, the UPA recorded a less impressive 3.5 times rise over its decade in office. The NDA’s emphasis on infrastructure — roads, railways, and logistics — not only boosts future productivity but also reflects asset-based deficit financing, a hallmark of prudent fiscal policy.
GST and the formalisation dividend: The rollout of the Goods and Services Tax (GST) under the NDA redefined India’s indirect tax regime. While initial disruptions impacted state revenues—requiring compensation from the Centre—long-term gains have emerged through better compliance and formalisation.
Technological interventions like the AIS, AI-driven analytics, and automated fraud detection have improved tax buoyancy, boosting both indirect and direct tax collections. This has helped the Centre expand expenditure while adhering to fiscal discipline.
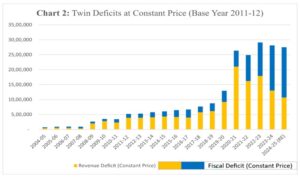
Deficits at constant prices: A deeper understanding emerges when deficits are viewed at constant 2010–11 prices. Under the UPA, the fiscal deficit ballooned from Rs 0.73 lakh crore to Rs 5.76 lakh crore — an almost eightfold increase. The revenue deficit surged nearly nine times — from Rs 0.46 lakh crore to Rs 4.09 lakh crore.
In contrast, the NDA recorded a more modest 4.65-fold increase in the fiscal deficit and a threefold rise in the revenue deficit over a comparable period. This performance, despite rising government expenditure, highlights the relative prudence of the NDA’s fiscal management.
A question of strategic spending
India’s experience with twin deficits under both UPA and NDA governments underscores the centrality of how — not just how much — a government spends. The UPA leaned heavily on borrowing to fund subsidies and consumption, while the NDA strategically channelled its deficits into capital formation and infrastructure.
Tax reform, banking sector stabilisation, and improved compliance have been hallmarks of the NDA’s approach, even as it battled structural legacies and unprecedented external shocks like COVID-19. Meanwhile, the UPA, though fiscally sound in its early years, lost direction after the global financial crisis and struggled to re-establish control.
With the NDA’s third term underway, it has signalled intent to restore fiscal balance — aiming for an effective revenue deficit of just 0.3% of GDP in 2025–26. The road ahead lies in sustaining its trajectory in anchoring fiscal policy on productive spending, while navigating the tightrope between social welfare needs and long-term economic sustainability.
Ritesh Kumar Baranwal is a research scholar at Jaypee Business School, JIIT, Noida. Dr Badri Narayanan Gopalakrishnan is founder, Infinite Sum Modelling LLC.

Dr Badri Narayanan Gopalakrishnan is Fellow, NITI Aayog. Views expressed are personal.