The reasons behind Kerala’s rising debt burden and the state’s significant welfare expenditure are topics of heated debate. Renowned for its commendable social development achievements, Kerala now stands at a crossroads, grappling with a deepening fiscal crisis that threatens its sustainable growth. While the state has garnered acclaim for social indicators akin to those of developed nations, recent attention has shifted to its increasingly precarious fiscal position.
Kerala’s financial crisis is not a recent development. The roots of this crisis extend beyond recent events, representing years of fiscal imbalances dating back to late 1980s. The state has faced deficits over the years, often with a capital account surplus, indicating high revenue expenditure but relatively low physical capital investment.
READ | Crumbling infrastructure threatens India’s economic growth
High revenue expenditure
Kerala’s revenue expenditure averages 90.39% of total expenditure (ranging from 91.8% in 2017-18 to 89.58% in 2022-23 RE). A significant portion of this expenditure is committed to the social sector. Salaries, pensions, and interest payments comprise 56% of total expenditure and 64.42% of revenue expenditure, accounting for 137% of the state’s own revenue (37% over and above total own revenue) and 81.1% of total revenue receipts. The social sector expenditure accounts for 80% of total development expenditure under the revenue account.
The persistence of fiscal imbalances in Kerala is a complex issue, influenced by political, institutional, and social factors. Extensive scholarly literature has examined the nexus between political dynamics and fiscal policy, highlighting the complexities inherent in coalition governments. Kerala has consistently been governed by such coalitions.
Frequent changes in government, coupled with large swing voter bases under heterogeneous social pressures, undermine the continuity and efficacy of fiscal reforms. The two equally powerful coalitions, each with multiple party interests and differences among decision-makers, often engage in a war of attrition, attempting to pass the burden of fiscal imbalances and reforms to their opponents, resulting in poor fiscal outcomes. Political dilemmas from anti-incumbency trends and economic uncertainty due to declining revenues, combined with heterogeneous group preferences and institutional pressures, are reflected in fiscal policy options rather than long-term growth potential.
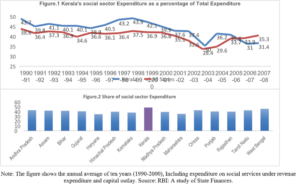
The state’s current fiscal position is the result of earlier investments in human development through social overhead capital (SOC). Up until the end of the 1980s, no other Indian state had spent as much on health and education as Kerala. In 1978-1979, Kerala’s social sector spending as a percentage of revenue expenditure was 52.05%, compared to the all-India average of 39.78% for all Indian states (see Figures 1 & 2). In terms of human development, Kerala significantly outstrips the national average. The state’s commitment to reducing wealth inequality is evident in its lower Gini coefficient, indicating a more equitable wealth distribution compared to the rest of India.
Figure 1 and 2
To maintain these achievements, Kerala must continue spending. Challenges include unemployment, especially educated unemployment, climate change, increasing morbidity, and a demographic transition marked by a rapidly aging population, contributing to the state’s morbidity burden and high dependency ratio. While these issues partly reflect development and improved healthcare, they also present challenges such as increased healthcare expenses and a shrinking workforce.
Without active financial support from the Union government, no state can function effectively. Kerala encounters excess expenditures over its revenues, partly relying on fiscal transfers from the Centre. Intergovernmental transfers aim to balance the fiscal disabilities of sub-national jurisdictions, rewarding states based on performance and providing specific purpose grants to augment services with high inter-state externalities or those considered highly meritorious.
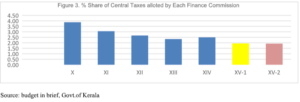
Kerala’s share of the divisible pool during the 10th Finance Commission was 3.87%, but it sharply declined to 1.925% in the 15th Finance Commission from 2.5% in the 14th Finance Commission (see Figure 3). The state’s diminishing share of the divisible pool, aggravated by rapid per capita income growth, underscores the challenges posed by central frameworks.
Confronted with second-generation problems, Kerala requires focused attention on wealth and income generation for deserving population sections. The state needs to generate sufficient revenue to reduce vulnerabilities. This requires socio-political consent, emerging from an objective analysis of the present situation and an honest appraisal of the facts, to create efficient participatory budgets that allocate public resources inclusively and equitably. This involves impact-oriented discussions and decisions about the budget, determining “who gets what, when, and how,” which is crucial for achieving sustainability.
Kerala has the potential to tackle its challenges, provided there is a shift in the mindset of the people, political parties, civil society, and the media. Support from the Centre is essential, as the Centre holds greater authority than the states in financial relations. It is not about winning or losing; Kerala needs a collective decision for development and to sustain its achievements. Taxation, government spending, and addressing the informal economy are crucial for redistribution and efficient resource allocation. Without these, the objectives of fiscal policy cannot be achieved, emphasising the need for a new political strategy within the democratic framework.
(Shamna Thachaparamban is assistant professor at Gulati Institute of Finance and Taxation, Thiruvananthapuram.)
Note: Gini coefficient measures the extent of distribution of income, ranging between zero in the case of perfect equality and 1 in the case of perfect inequality. Dependency ratio shows the dependent population compared to the working age population. Source: NITI Aayog.
Note: The figure shows the annual average of ten years (1990-2000), Including expenditure on social services under revenue expenditure and capital outlay. Source: RBI: A study of State Finances.